How to (Really) Measure Your Coupons & Discounts
Discounting is a core strategy for most D2C brands. Putting a critical eye to your measurement of offers and discounts can increase profitability (and marketing impact) of your offers
If you’re a business that offers discounts to your customers, discounting is most likely a hot topic across the organization. And that hot topic can range from a constant debate to an all out war across different parts of the organization.
Within marketing, it can feel hard to drive forward your initiatives without at least some occasional offers or discounts, and to finance it can seem like there is always a sale coming to eat into your profit margins.
For many businesses, offers will always be a core part of how they will operate. Many fast food restaurants rely on offers as one of their core ways to entice new customers and encourage purchases into new categories. And others take advantage of sales to offload merchandise or to encourage new customers to purchase.
While there are some businesses that do not discount (think luxury brands) almost all do consider discounting as at least one of the tools in their toolbox for encouraging their customers to purchase more frequently.
But the big question is - do those discounts make a positive difference for your business?
Get More Data-Informed With Discounts/Offers
If you are a business that heavily relies on offers, it should be one of the core focuses of your analysis efforts. Since you are likely reducing the profit margin on your product, it’s critical to understand just how those offers helped you drive incremental sales to make up for the loss in margin.
“ Incremental sales - sales from an initiative (for example, an offer or a discount) that would not happened otherwise”
Why is that so important? Well, consider if you run an offer that didn’t drive incremental sales and instead:
Caused a customer that would have purchased anyways to get a discount, lowering your average order value and profit
Cannibalized a purchase that would have happened at a later date with the same effect as the above point
Discouraged the sale of a higher profit margin product
Suppresses purchases throughout the year because customers are trained to only purchase during a sale
Lowers your brand perception/product quality perception because of heavy discounting
Obviously, you want to minimize those outcomes and maximize the possible benefits of having a discount. And the way you do that is by being data-informed with your offers.
If your analytics AND finance teams aren’t heavily involved in evaluating your offers - that’s the first place to start. And by heavily involved, we mean that offers should be:
A/B tested
Evaluated post coupon effectiveness (and having a strong say in whether comparable offers are ran again)
At the forefront of data-science initiatives
Carefully tagged and tracked in your analytics systems
Opening the door to data teams can seem scary at times - that’s the biggest theme we have seen here at Insight Lime. Marketers are scared. They’re scared that analysts will come in and tell them that their offers aren’t profitable and take away what they believe is their most effective marketing platform.

The First Steps to Coupon Measurement
Check coupon tracking capabilities
If you aren’t currently making it easy for both your finance and digital analytics teams to easily see couponing in their analytics tools (like Google and Adobe Analytics) and within finance systems, this is a critical first step.
2. Keep a shared coupon calendar
It’s difficult for data teams to evaluate the success of offers when they aren’t aware of their timing, so having this information easy to access and communicating it well ahead of time will help support your analysis efforts.
3. Begin measuring a % discounted metric (and set a goal for it)
As a business that discounts, you should be working cross-functionally to determine what an acceptable average discount amount is and also the amount of discounted purchases as a whole. Here are a few metrics (and their formulas) to consider for your business:
“% of sales discounted = (# of discounted purchases/total purchases) x 100
Net product profitability, post discount = Product price post discounting - COGs (cost of goods sold)”
You may have slightly different definitions you choose to use or are currently using for your business. But, beginning to surface the % of total sales discounted when having conversations about your coupon strategy is going to help put things in perspective. Do you want to have your % of sales discounted at 30% for an entire quarter? What does that do to your brand perception?
If your business has been focusing on improving profitability, you should consider setting a goal for a lower total discounted purchases % than what you currently have.
4. Follow coupon users’ behavior, and segment
What do your coupon users do after their purchase? What were they doing before?
If you haven’t before, have your analytics team do an analysis for you that covers the following business questions:
What are the differences between our customers who use coupons and those who do not? (Demographics, overall purchase behavior, marketing channels, website content they consume)
Compare cohorts from people who purchased during a sale & those who did not. How do they differ?
What offers in the past year/quarter had the most redemptions? Which ones had the least?
5. Gather this information and discuss as a cross-functional team
Get marketing, analytics, finance, and product together to discuss your findings. You might not be used to working this way, but hearing everyone’s opinions in one place will help color the push and pull that is already happening in your company. You likely already have a finance team that is concerned about over-discounting, and performance marketing teams that are anxious that they won’t get their offers approved for the next quarter.
The Holy Grail(s) of Coupon Measurement
If you’ve checked off the basics above, more can be done to get to the incrementality of your coupons/offers. While there are a lot of projects that you could undertake, there are a few that we consider the “holy grail” of offer measurement that are high ROI analysis projects to run.
Sales Fatigue Analysis
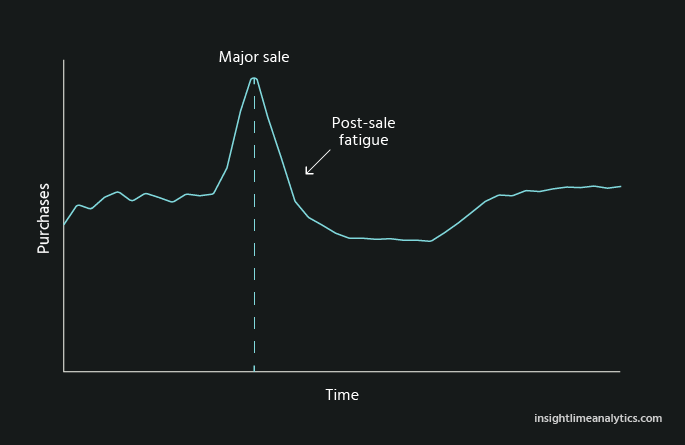
Sales fatigue is evaluating whether there is a dip after a sale and/or behaviors your customers display that show that they have been over-promoted to or are not purchasing because they have recently purchased with a sale instead.
2. Long term incremental lift from sales
If your finance team has been pushing back on your coupons and sales because of the impact on your profitability for individual products or during certain periods, one way to evaluate the longer-term “lift” from your discounts to see if they are worth it is to follow up with an incremental lift from that coupon over time.
This is especially impactful when you bring in new customers with an offer. Sure, it’s great if you get a new customer in the door - but the bigger test of time is if they come back again. You can take a one-time profitability hit if you know that it’s going to bring in customers with a lifetime value that provides future returns.
Requirements for running a long-term incremental lift project:
User-ID level tracking - this works especially well for companies that have customer accounts that are heavily adopted. Without account-based tracking, the longer term impact of these types of analysis will be obscured by turnover of cookie based tracking (people eventually clear their browsers, shop from different devices, etc)
Ability to tie coupon usage to the User-ID/account level
The first requirement can be difficult to achieve, but as cookies become a less reliable way to track customers we would highly encourage you to explore ways to increase the number of logged-in users.
If you have the above, looking at long term incremental lift is relatively straightforward.
Identify a coupon or sale to evaluate
Pull the user ID’s for all NEW customers who used that offer
Pull the following purchase information for the following 3/6/12 months (12 months is our favorite if possible) and see the long-term re-purchases/time period value of those customers
(Bonus) Compare to an “average” non-sale cohort to see if the purchase frequency is higher or lower for the coupon group
If you see that you are bringing in customers at the average rate (or higher rate) than a non-coupon cohort, and there is a good amount of those purchasers that remain to purchase again you can justify that type of discount much better to your finance teams.
If it does not drive impactful revenue after the first purchase…it may be time to re-evaluate your coupon and consider not running a comparable offer again.
3. Offer Suppression & Generation (Machine Learning)
Most of our suggestions are more simple analysis that almost any analyst can do. Our final ideal state is starting to create coupon-usage predictions from your purchasing data. This requires data science to do real-time. The idea is that you begin to follow customer purchasing behaviors to identify those customers that were going to purchase anyways, but tracking key pre-purchasing behaviors. This can suppress offers in advertising and on-site to people who will purchase anyways without an offer.
On the other side, a similar system can begin to surface offers when it will push them over the edge to make a purchase.
There are some tools to help you do this even if you don’t have a full data science team, but you should carefully evaluate their claims. If you choose to go with one of these tools, make sure you can evaluate the revenue they generate yourself (in your own systems).
Let’s get squeezing!
Join our founder on Linkedin and hear thought-leadership on marketing analytics and analytics consulting.


“[Insight Lime] are great at identifying the issues and providing a solution.”


Search for more blogs and content you’ll love
Need more help calculating the impact of your offers? We’re here to help 💚


Let’s get squeezing!
Join our founder on Linkedin and hear thought-leadership on marketing analytics and analytics consulting.


